
T1- and ECV-mapping in the Heart


U.S. Department of
Health and Human
Sevices
National Institutesof Health
National Heart, Lung,and Blood Institute
Peter Kellman, Ph.D.
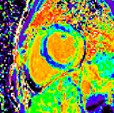
ECV
300
700 ms
0
2000 ms
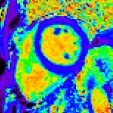
Pre-contrast T1
Post-contrast T1
0%
100%
Disclosures
I have no financial relationships to disclose.
- and -
I will discuss the following off label use in my presentation:
Use of contrast agent for late enhancement imaging
Peter Kellman, Ph.D., NHLBI/NIH
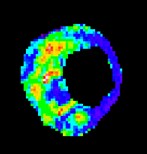
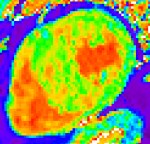
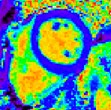
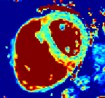
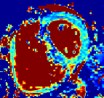
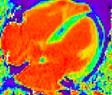
(A) Quantifying Myocardial & Blood T1(B) Quantifying Extracellular Volume (ECV)(C) Pixel-wise parametric maps
•“Global” Abnormality
•Diffuse Fibrosis & Diffuse Edema
•Focal abnormalities
•Area-at-risk & border zone quantification
•Remote regions
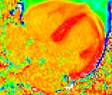
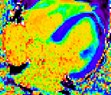
Motivation:
cardiac amyloidosis
acute myocarditis
0%
20.4%
25.4%
30.4%
100%
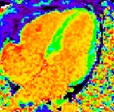
normal
ECV Maps
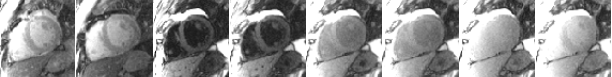
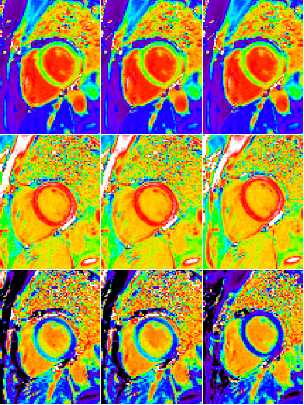
MOLLI Image Acquisition
BLOOD
MYOCARDIUM
1
-1
0
TD

1
-1
0
TD
Inversion
pulse
TI6
TI7
TI8
Inversion 2
TI1
TI2
TI3
TI4
TI5
Inversion 1
Inversion
pulse
recovery
period
Messroghli DR, et al. Optimization and validation of a fully-integrated pulse sequence for modified look-lockerinversion-recovery (MOLLI) T1 mapping of the heart. J Magn Reson Imaging 2007;26:1081-6.
Design Factors:
•Protocol parameters (matrix size, parallel imaging,partial Fourier, flip angle, echospacing, MOLLIacquisitions, recovery, inversion times)
•Sequence Design (slice profile, inversion pulseefficiency and bandwidth, SSFP steady state run-up)
•Scanner adjustments (shim & center frequencyadjustments) & performance (zFOV)
•Tissue characteristics (T2, flow) & patient heart rate
Respiratory Motion Correction (MOCO)
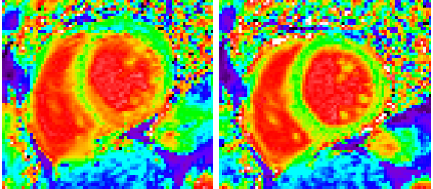
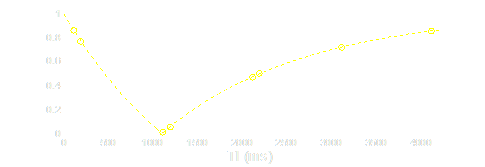
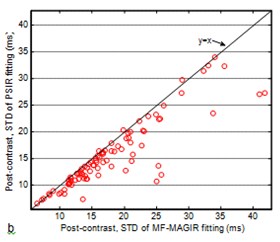
PSIR reconstruction improve fits


0
500
1000
1500
2000
2500
3000
3500
4000
4500
5000
-100
-80
-60
-40
-20
0
20
40
60
80
100
PSIR Fit
Magnitude IR Fit
inversion time (ms)
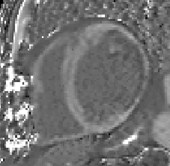
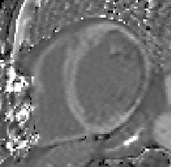
Xue H, et al. Motion Correction for Myocardial T1 Mapping Using Image Registrationwith Synthetic Image Estimation. Magn Res Med. 2012 Jun; 1644-55.
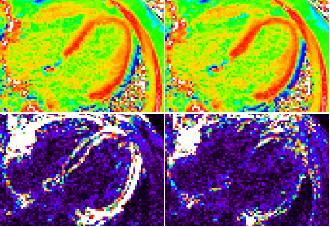
T1 and ECV maps (simplified)
respiratory motion correction (MOCO) &
co-registration of pre- and post-contrast images
MOCO
MOCO
blood
segmentation
ECV map
calculation
measured
hematocrit
(% HCT)
R1blood
0%
100%
0
2000 ms
0
600 ms
blood mask
pre-contrast
image series
post-contrast
image series
pre-contrast
T1-map
images at
longest
inversion time
(TI)
co-
registration
T1-fitting
T1-fitting
pre
post
post-contrast
T1-map
T1* fit
in blood
ECV =
(1-HCT) R1m/R1b
non-MOCO
Pre-contrast
T1-maps
Post-contrast
T1-maps
ECV-maps
MOCO
MOCO+co-reg
N=600 maps across 338 subjects
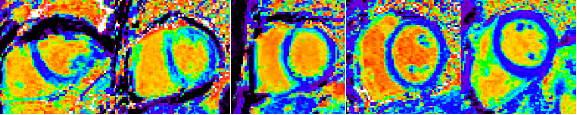
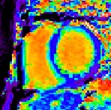
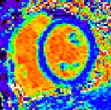
non-diagnostic poor fair good excellent
example maps for each quality category
Quality of ECV maps
non-diagnostic poor fair good excellent
< 1% (non-diag)
2% (poor)
14%
37%
46%
excellent
good
fair
0
50
100
150
200
250
300
< 1%
85%
14%
< 1%
82%
17%
2%
17%
81%
pre-contrast T1-map
MOCO performance
post-contrast T1-map
MOCO performance
ECV-map co-registration
performance
better
better
better
same
same
same
worse
worse
worse
Performance of motion correction& co-registration
0.2
0.25
0.3
0.35
0.4
0.45
0.5
0.55


without MOCO &
co-registration
with MOCO &
co-registration
ECV
normal myocardium (mid-wall)
Measured ECV values (n=102 subjects)
for normal myocardium
Artifacts:
•Partial volume
myocardium-blood
myocardium-fat
•Motion and co-registration errors
•Off-resonance
MOCO
non-MOCO
T1-maps
residual
fit error
magnitude
0
600 ms
Usefulness of Quality Metrics?
Goodness of fit
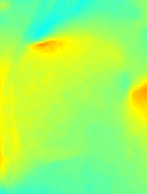
Usefulness of Quality Metrics?
Field maps
fieldmaps
(frequency)
-200
-100
0
100
200
Hz
Summary:
•ECV is an emerging method for detection of diffuseprocesses
•ECV pixelmaps improve confidence and are useful forcharacterizing heterogeneity
•Motion correction & co-registration are important
•Fixed scale facilitates visualization & thresholding
•Sequence design and protocol parameters influenceaccuracy and precision
•Processing has been fully automated
20.4
25.4
30.4