
Influence of Off-resonance inMyocardial T1-mapping using SSFPbased MOLLI Method
Peter Kellman
Daniel A Herzka
Andrew E Arai
Michael Schacht Hansen

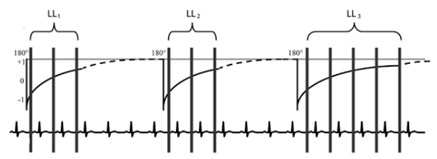
MOLLI Image Acquisition
Messroghli DR, et al. Modified Look-Locker inversion recovery (MOLLI) for high-resolution T1 mapping of theheart. Magn Reson Med. 2004;52(1):141-6.
Messroghli DR, et al. Optimization and validation of a fully-integrated pulse sequence for modified look-lockerinversion-recovery (MOLLI) T1 mapping of the heart. J Magn Reson Imaging 2007;26:1081-6.
3(3)3(3)5
protocol

0
0
1
TI (ms)
pixelwise fit
T1 map
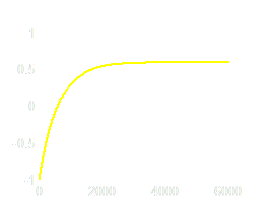
3-parameter model
S = A – B exp(-TI/T1*)
T1 ≈ T1* (B/A – 1)
combined influence ofreadout & off-resonance
Simple correction for T1* based on continuous FLASH readout leads to error
Gai ND, et al. Modified Look-Locker T(1) evaluation using Bloch simulations: Human andphantom validation. Magn Reson Med. 2012 Mar 27.
Kelvin Chow, et al. T2-dependent errors in MOLLI T1 values: simulations, phantoms, and in-vivo studies. J Cardiovasc Magn Reson 2012, 14(Suppl 1):P281.
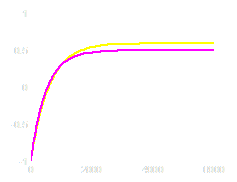
ideal recovery
influence ofreadout
(on-resonance)
Influence of readout leads to apparent T1
off-resonance
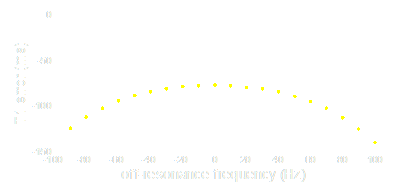
SSFP off-resonance response atsteady statevarious excitation flip angles
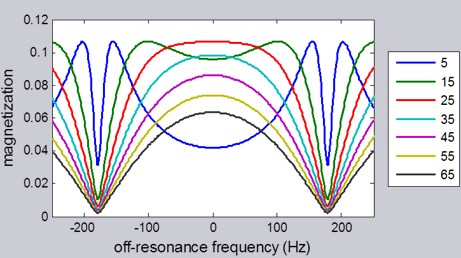
(for TR = 2.8)
SSFP off-resonance response duringtransient approach to steady statevarious excitation flip angles
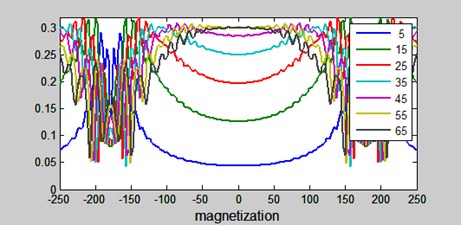
(for TR = 2.8, N=33 to center, +5 linear ramp)
SSFP off-resonance response duringtransient approach to steady statewith inversion recovery initial condition
(MOLLI with FA = 35 deg, TR = 2.8, N=33 to center, +5 linear ramp)
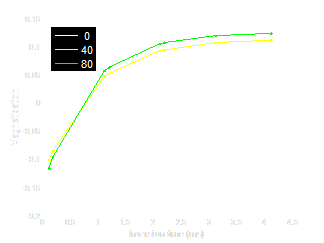
inversion recovery
SSFP transient frequency response
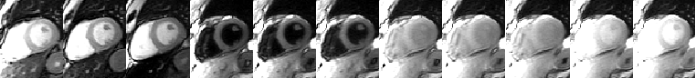
apparent inversion recovery influenced by off-resonance
TI1
TI2
TI3
TI4
TI8
TI7
TI5&6
TI1
TI2
TI3
TI4
TI5
TI6
TI7
TI8
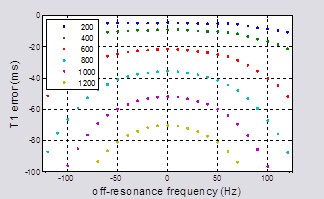
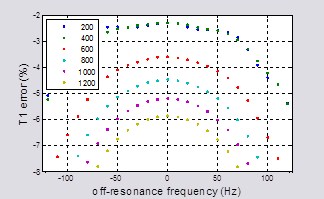
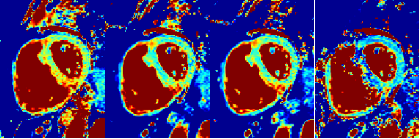
T1-error due to off-resonanceusing MOLLI 5(3)3 protocol with 35°& T2=45 ms
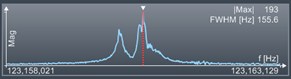
Phantom measurementsclose agreement with prediction from simulation
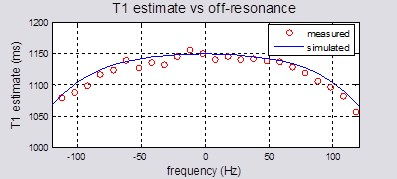
T1 = 1197 ms and T2 = 47 ms
max off-resonance:82.8 ± 36 Hz
est. T1-error @ 82 Hz:2% at 400 ms
4% at 1000 ms
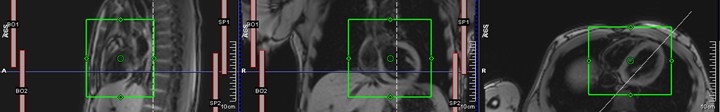
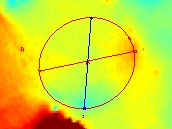
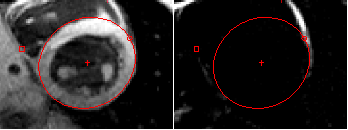
Fieldmaps ± 200 Hz
Water images
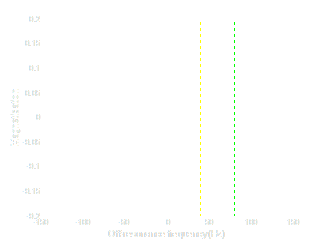
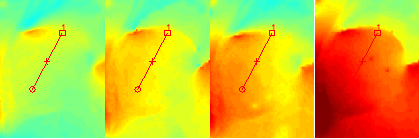
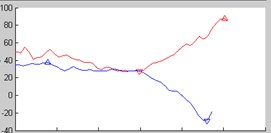
Off-resonance variation at 1.5T:measured across LV in N=20 subjectswithout using local shim
Off-resonance variation:measured across LV in N=18 subjectsusing local box shim

Mean off-resonance
Maximum off-resonance
1.5T
20.3±13.0Hz
61.8 ± 15.5 Hz
3.0T
15.4±29.3Hz
125.0 ± 40.6 Hz
-200
-100
0
100
200
800
1000
1200
0
10
20
30
40
50
60
70
80
0
50
100
150
200
250
profile distance (mm)
frequency (Hz)
T1-maps
fieldmaps
(frequency)
frequency across heart
msec
Hz
1
1
2
3
2
4
3
4
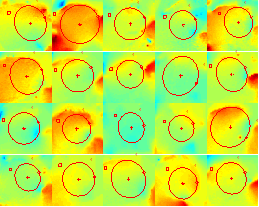
Off-resonance variation of T1-maps
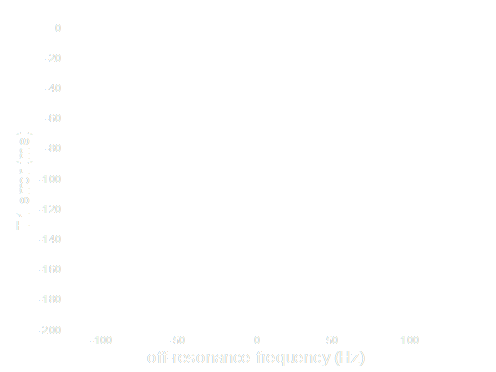
T1 = 1300 ms
T2 = 45 ms
On-resonance
error
Off-resonance
sensitivity
T1-error and sensitivity to off-resonanceMOLLI with b-SSFP FA = 35 deg, TR = 2.8 ms
fat
water
fieldmap
Local shim (3T example)
-100 Hz
-75 Hz
-50 Hz
-25 Hz
0 Hz
25 Hz
50 Hz
75 Hz
100 Hz
900
1000
1100
1200
1300
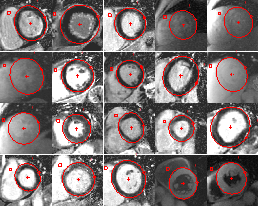
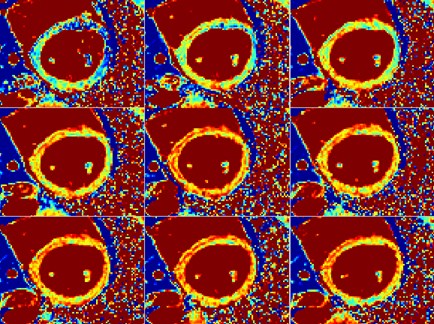
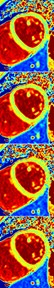
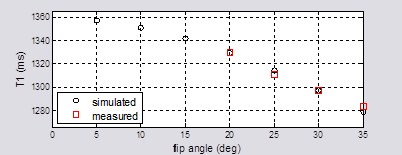
Sensitivity of T1-maps to off-resonance
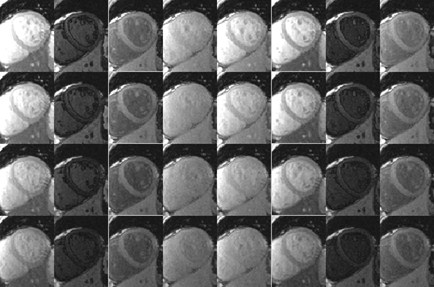
35°
30°
25°
20°
T1-maps
1284 ms
(septum)
1330
1312
1298
SNR = 36
SNR = 29
27
23
raw MOLLI images at 3T using 5(3s)3 protocol
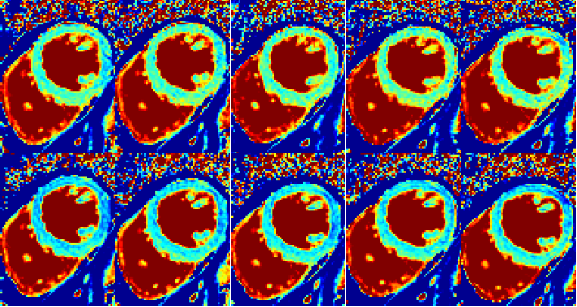
1000
1200
1400
1600
-50 Hz
-25 Hz
0 Hz
25 Hz
50 Hz
20°
35°
20°
35°
Lower FA tradesSNR (precision) forimproved accuracy andreduced off-resonancesensitivity
Summary:off-resonance sensitivity
•b-SSFP transient approach to steady state
•off–resonance response depends on initial conditions
•initial conditions depend on inversion recovery time
•therefore, apparent T1 depends on off-resonance
•T1-underestimation
•Off resonance error worse at higher excitation flip angles
•Significant errors may arise well within SSFP passband
•Local “box” shim recommended
•Shim variation may lead to artifacts
•may appear as regional variation in T1